

Industrial Intelligence
Starts Here.
Jugno.ai connects the physical industrial world to intelligent operational decisions — hardware at the asset, connectivity at the edge, and platforms that turn machine, vehicle and utility data into action.
- Asset
- →Edge
- →Cloud
- →Intelligence
- →Action
Active
128
Idle
14
Alerts
3
Avg SOC
72%
Vehicle health
Illustrative interface. Values shown are examples, not measured data.
Hardware, edge, cloud and intelligence from one engineering team
- Industrial hardware
- Edge connectivity
- Cloud platform
- Industrial data model
- Analytics & AI
- OEM white-label
- Operational applications
Specialized Industrial Intelligence Platforms
Jugno.ai develops independent platforms. Each has its own cloud platform, mobile application, dashboards, APIs, users and deployment.

Jugno Pulse®
Connected Mobility Intelligence
Vehicle data from CAN, J1939 and OBD interfaces, combined with location and battery behaviour, delivered to OEMs, dealers and fleet teams as a white-label platform and mobile application.
Active
128
Idle
14
Alerts
3
Avg SOC
72%
Vehicle health
Illustrative interface. Values shown are examples, not measured data.
Vehicle 042
Healthy · Last trip 41 km
78%
State of charge
- LocationDepot North
- Next serviceIn 1,200 km
- Open alerts1
OEM-branded mobile app
Connected vehicle
CAN, J1939, OBD and GPS at the vehicle
Data
Trips, usage, battery and fault codes
Intelligence
Behaviour baselines and deviation detection
Diagnosis
Remote fault context before dispatch
Service action
Dealer and service workflows, spare planning
Customer value
Uptime, warranty insight, after-sales services
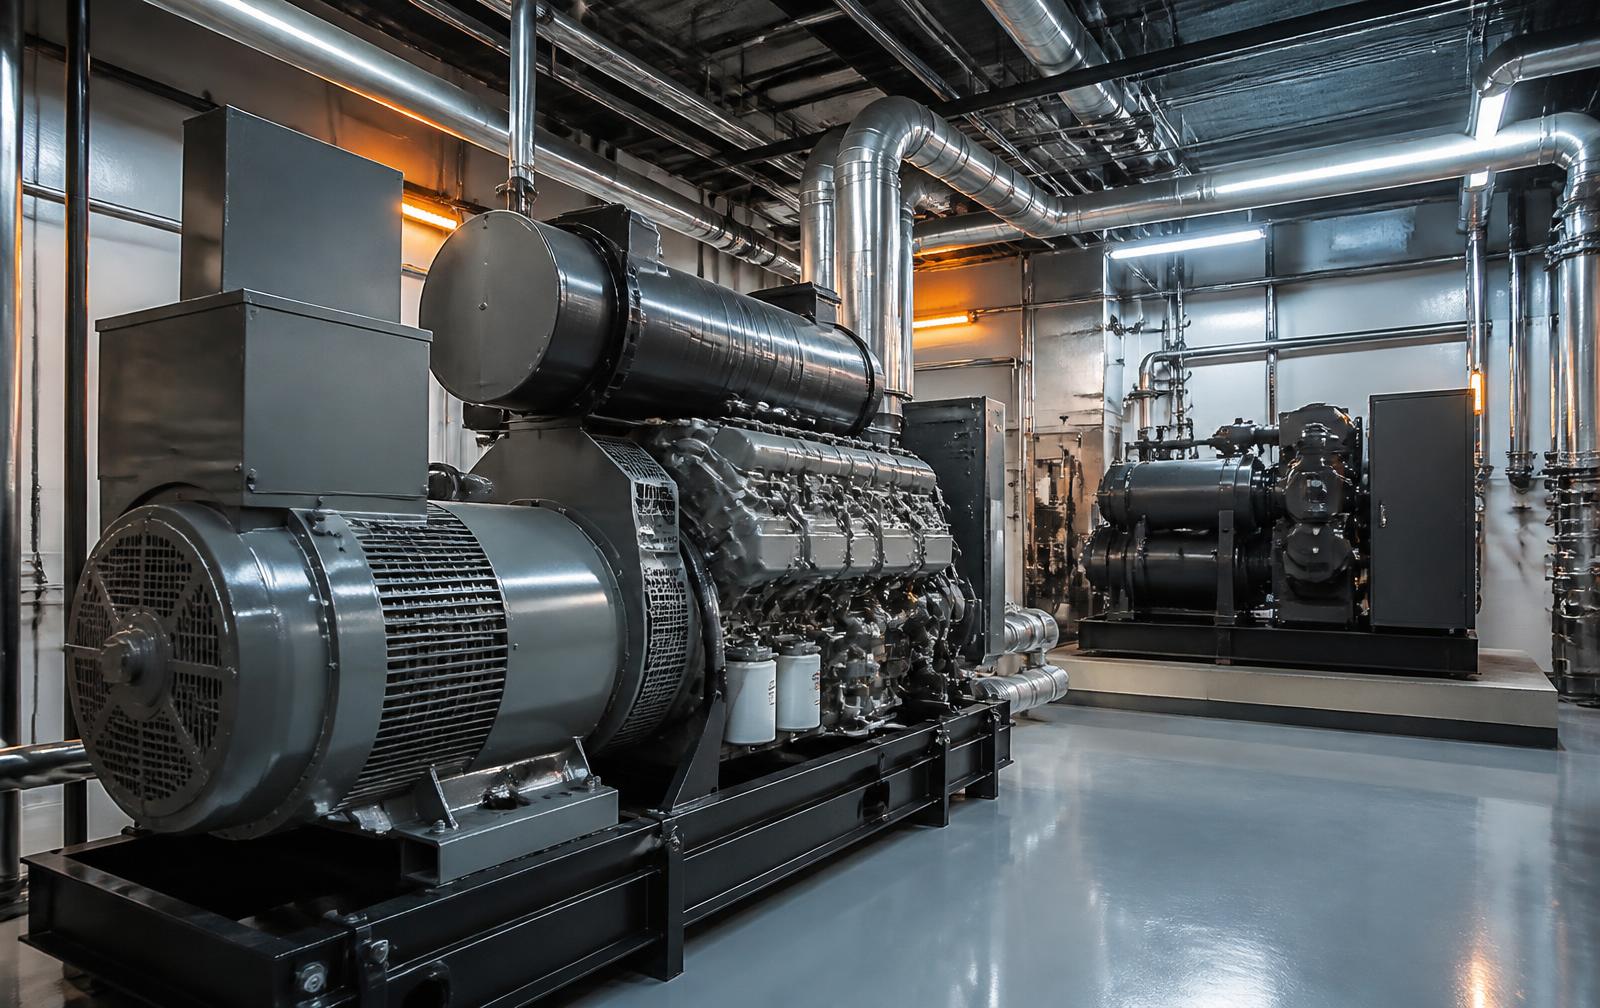
Jugno Echo®
Industrial Equipment Intelligence
Generators, compressors, chillers, pumps and production machines connected through Modbus, RS485 and PLC interfaces — with equipment health, operating patterns and service intelligence across the installed base.
Running
42
Load
72%
Runtime
1,284h
Open alarms
2
Vibration trend
Deviation from baseline since 06:00
Equipment states
Illustrative interface. Values shown are examples, not measured data.
Compressor-04
Vibration above baseline
72%
Current load
- AlarmVibration
- Since06:00
- AssignedService team
Service & maintenance app
Connected equipment
Controllers, PLCs and sensors on the asset
Data
Load, temperature, vibration, runtime, energy
Intelligence
Operating patterns and anomaly detection
Diagnosis
Probable cause with supporting evidence
Service action
Work order, AMC and spare-part planning
Customer value
Availability, lifecycle and product intelligence
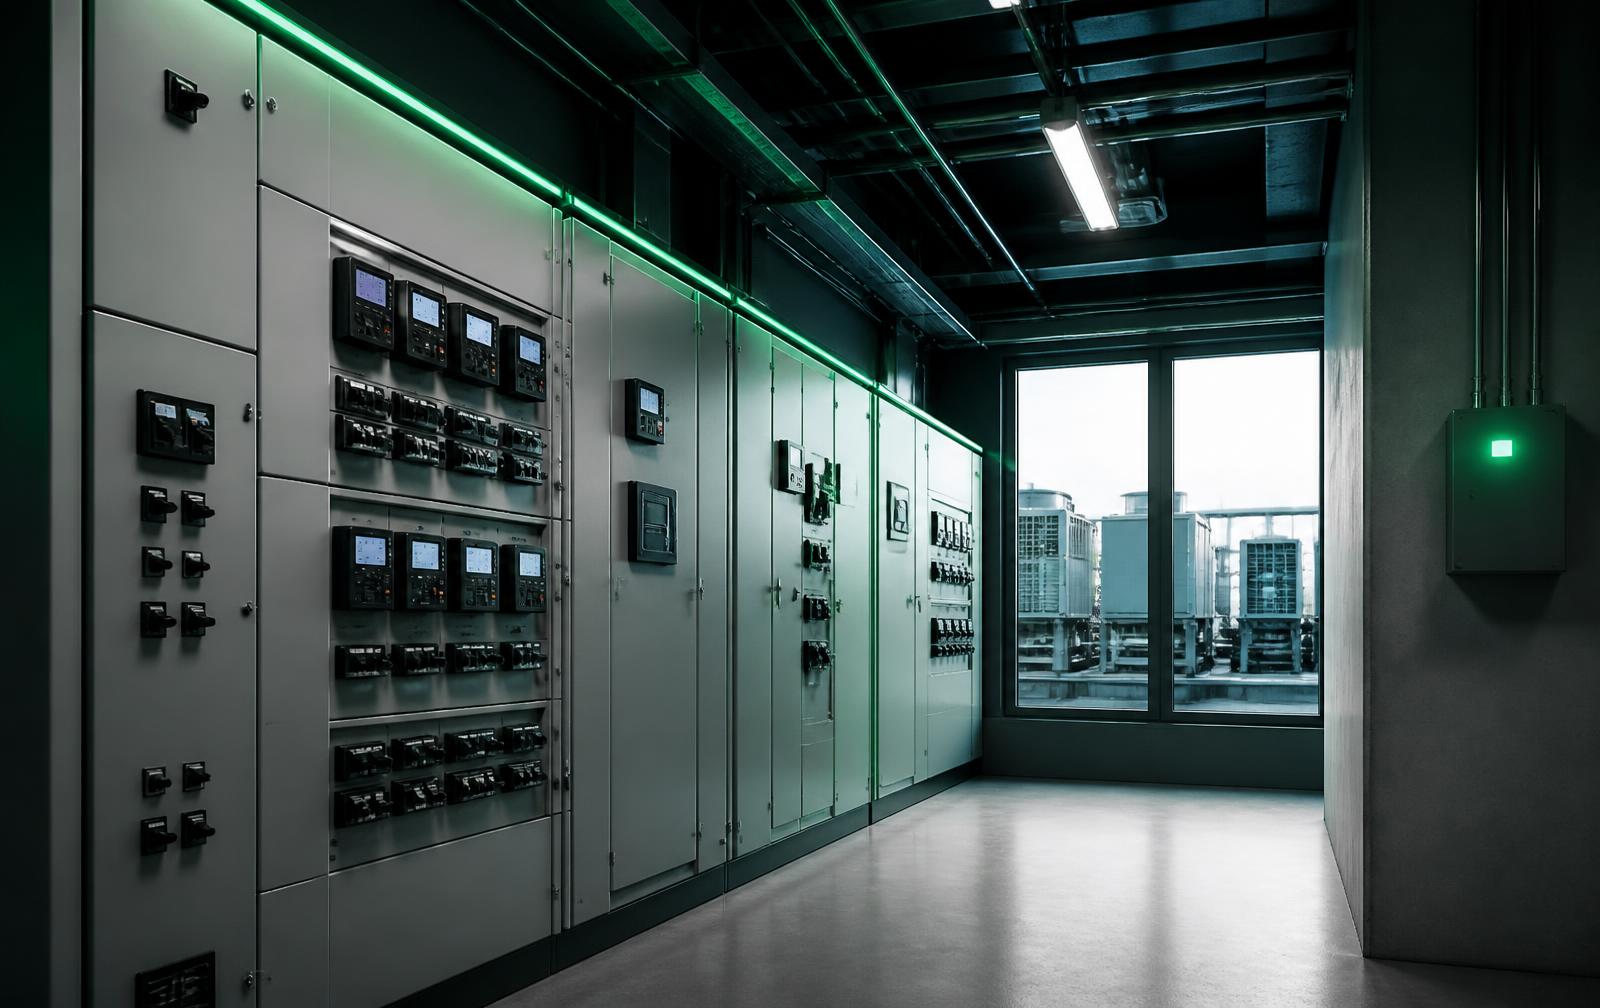
Jugno Core®
Energy & Infrastructure Intelligence
Panel-level energy, HVAC, DG, water, gas and power quality across buildings, warehouses, plants and data centres — monitored, explained and optimised from one operational view.
Today
8,421kWh
Peak demand
612kVA
Power factor
0.96
DG
Standby
Consumption by hour
HVAC · Utilities · ProcessHVAC
Normal
Water
Normal
Power quality
Watch
Illustrative interface. Values shown are examples, not measured data.
Facility 01
Consumption above pattern
8,421
kWh today
- Peak demand612 kVA
- HVAC share38%
- Open alerts2
Facility operations app
Monitor
Grid, panel, load, HVAC, DG, water and gas
Understand
Consumption in the context of operations
Detect anomaly
Deviation from established patterns
Identify pattern
Which system and period drove the change
Recommend
Operational corrections worth reviewing
Optimise
Lower cost per unit and better utility performance
From Industrial Assets to Intelligence
The same engineered path in every deployment — from the signal on the asset to the decision in an operator's hands.
Assets
Vehicles, machines, meters and building systems already on site.
- Vehicles
- Machines
- Meters
- Sensors
- Controllers
Connect
Protocol-native acquisition from existing control equipment.
- CAN
- J1939
- Modbus
- RS485
- BACnet
- OBD
- MQTT
Edge
Local processing, buffering and secure transmission.
- Jugno Edge
- Buffering
- Translation
Cloud
Asset context, history and a consistent operational data model.
- Data
- Asset context
- Analytics
Intelligence
Baselines, anomalies and recommendations against your own operations.
- Anomaly detection
- Patterns
- Predictive insight
Action
Decisions reaching the people and systems that act on them.
- Dashboards
- Mobile
- Alerts
- APIs
- Service
How data becomes an operational decision
Intelligence is only useful when it can be explained. Every insight carries the observation, the comparison and the recommended action behind it.
Intelligence trace
IllustrativeWhy did energy consumption increase yesterday?
Consumption rose outside the expected operating pattern for this facility.
Historical pattern
Weekday baseline of roughly 7,100 kWh
Current pattern
8,421 kWh, concentrated between 14:00 and 17:00
Deviation
Largest variance associated with HVAC load
Possible cause
Extended cooling with no matching occupancy change
Recommended action
Review HVAC scheduling and setpoints for the afternoon block, then confirm against the next operating day.
Intelligence trace
IllustrativeWhich machine is behaving differently?
Abnormal operating pattern detected on a compressor within the installed base.
Signal detected
Vibration trending above its own baseline since 06:00
Pattern analysis
Rise correlates with load cycling, not ambient conditions
Anomaly identified
Deviation sustained across consecutive run cycles
Possible cause
Mechanical wear or mounting condition worth inspection
Recommended action
Schedule an inspection at the next planned stoppage and capture readings before and after.
Ask your industrial data
Concept — capability in developmentPeriod
14:00–17:00
Deviation
+1,321 kWh
Largest driver
HVAC
Ask your industrial data
A conversational layer over your own operational history — designed so that an answer always shows the data behind it. This is shown as an intelligence concept; it is a capability in development, not a deployed feature.
- Why did consumption increase?
- Which machine is behaving differently?
- Which vehicle needs attention?
- What changed from normal operation?
Built From the Asset to the Application
Jugno designs the edge hardware and the platform above it, so responsibility for the data path sits with one team.
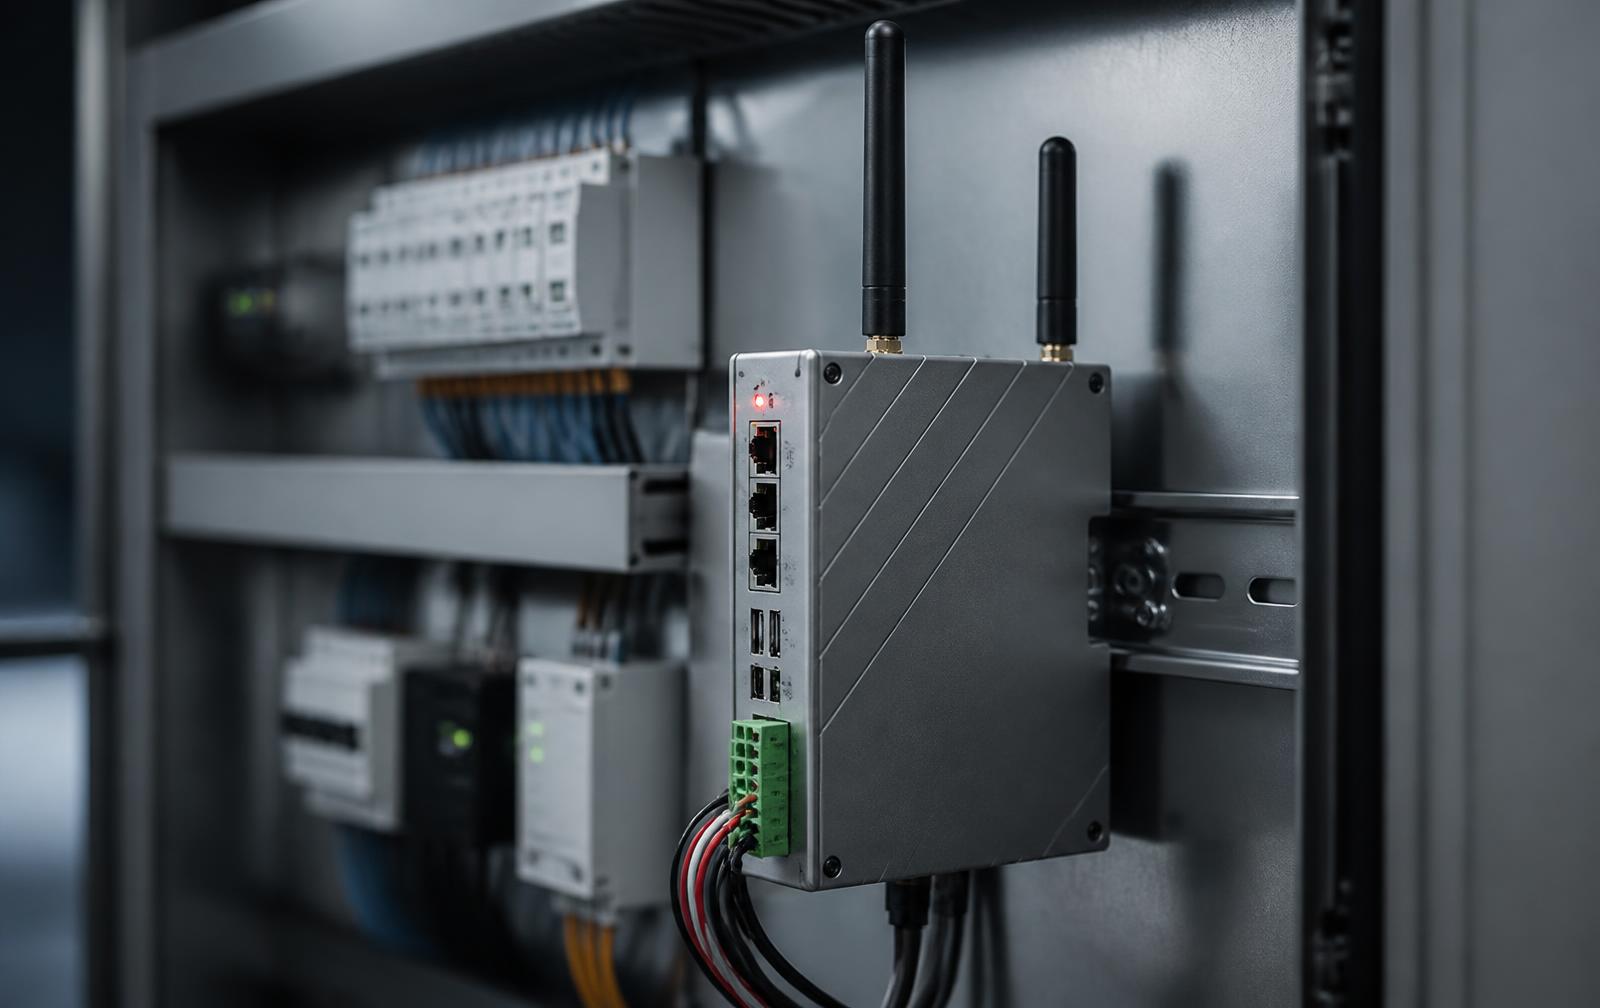
Jugno Edge
Industrial gateways sit alongside existing controllers and meters, read the interfaces the equipment already exposes, and keep data intact when connectivity drops. No rip-and-replace of your control layer.
- CAN
- J1939
- OBD-II
- Modbus RTU/TCP
- RS485
- BACnet
- MQTT
- Ethernet
Protocols are supported where the asset and deployment allow; coverage varies by platform and installation.
Signals into a single structure
- 1
Enterprise
Group-level view across every connected operation
- 2
Site
Plant, depot, warehouse or building
- 3
Area
Line, floor, feeder or zone
- 4
Asset
Machine, vehicle, DG set, chiller or panel
- 5
Device
Edge gateway, controller or meter
- 6
Data point
Load, temperature, vibration, energy, position
Large fleets stay understandable
Every connected asset is modelled in one hierarchy, so a group view, a single site and one data point all describe the same operation. Device management, alerts, reports and APIs follow that structure.
- Device management
- Asset management
- Dashboards
- Alerts
- Reports
- APIs

Built for the operations that cannot stop
Manufacturing plants, vehicle and equipment OEMs, warehouses, commercial buildings and critical facilities — the environments where a stoppage is measured in money.
Automotive & EV
Manufacturing
Warehousing & Logistics
Commercial Buildings
Construction Equipment
Data Centres
Fleet Operations
Public Infrastructure
A partner accountable from sensor to decision
Industrial Expertise
Built by engineers who have commissioned plants, depots and building systems.
Hardware + Software
Our own edge gateways paired with the platform — one accountable partner.
OEM Ready
White-label platforms and OEM-branded applications for vehicle and equipment makers.
Open Integration
Open APIs and connectors into ERP, CMMS, SCADA and BI systems.
Scalable Architecture
One site or two hundred, on the same data model and hierarchy.
Staged Deployment
Pilot on a defined set of assets, then extend site by site without downtime.
Built in India
Designed for Indian industrial conditions while supporting global deployments.
Protocol-Native
Reads the interfaces your equipment already exposes, where supported.
Explainable Insight
Every recommendation shows the data and comparison behind it.
Results your leadership team can measure
Reduce Downtime
Identify failure patterns early and protect production availability.
Improve Asset Utilisation
Measure true utilisation across vehicles, machines and equipment.
Optimise Energy Use
Track consumption against verified baselines and reduce cost per unit.
Increase Operational Visibility
One consolidated view across every site, plant and connected asset.
Plan Maintenance by Condition
Move from fixed calendars to asset condition and usage.
Accelerate Decisions
Give leadership verified operational data at the moment it matters.
Common enterprise questions
Jugno.ai connects industrial assets — vehicles, machines, meters and building systems — to a platform that turns their data into operational decisions. We supply the edge hardware, the connectivity, the cloud platform and the analytics above it.
No. They are independent platforms with their own cloud environments, mobile applications, users and deployments. They are chosen by the type of asset you operate, not as tiers of one product.
Depending on the platform and the asset, Jugno can work with CAN, J1939, OBD-II, Modbus RTU/TCP, RS485, BACnet, MQTT, REST and Ethernet interfaces. Coverage is confirmed per deployment against the equipment on site.
Cloud, on-premise and hybrid deployments can be supported depending on the platform and project requirements. The deployment model is agreed during the technical review.
Usually not. Jugno Edge reads the interfaces your controllers, meters and vehicle buses already expose. Additional sensors are added only where a required measurement does not exist.
Data is transmitted over encrypted channels, access is role-based, activity is recorded through audit trails, and integrations use secured APIs. Data ownership stays with the customer.
Trusted by Industry Leaders
Teams across mobility, industrial and infrastructure operations build on Jugno.ai to connect, monitor and optimize their assets.










Ready to Modernize Your Operations?
Tell us what you are trying to monitor, connect, predict or optimise — and we will map it to the right platform.