
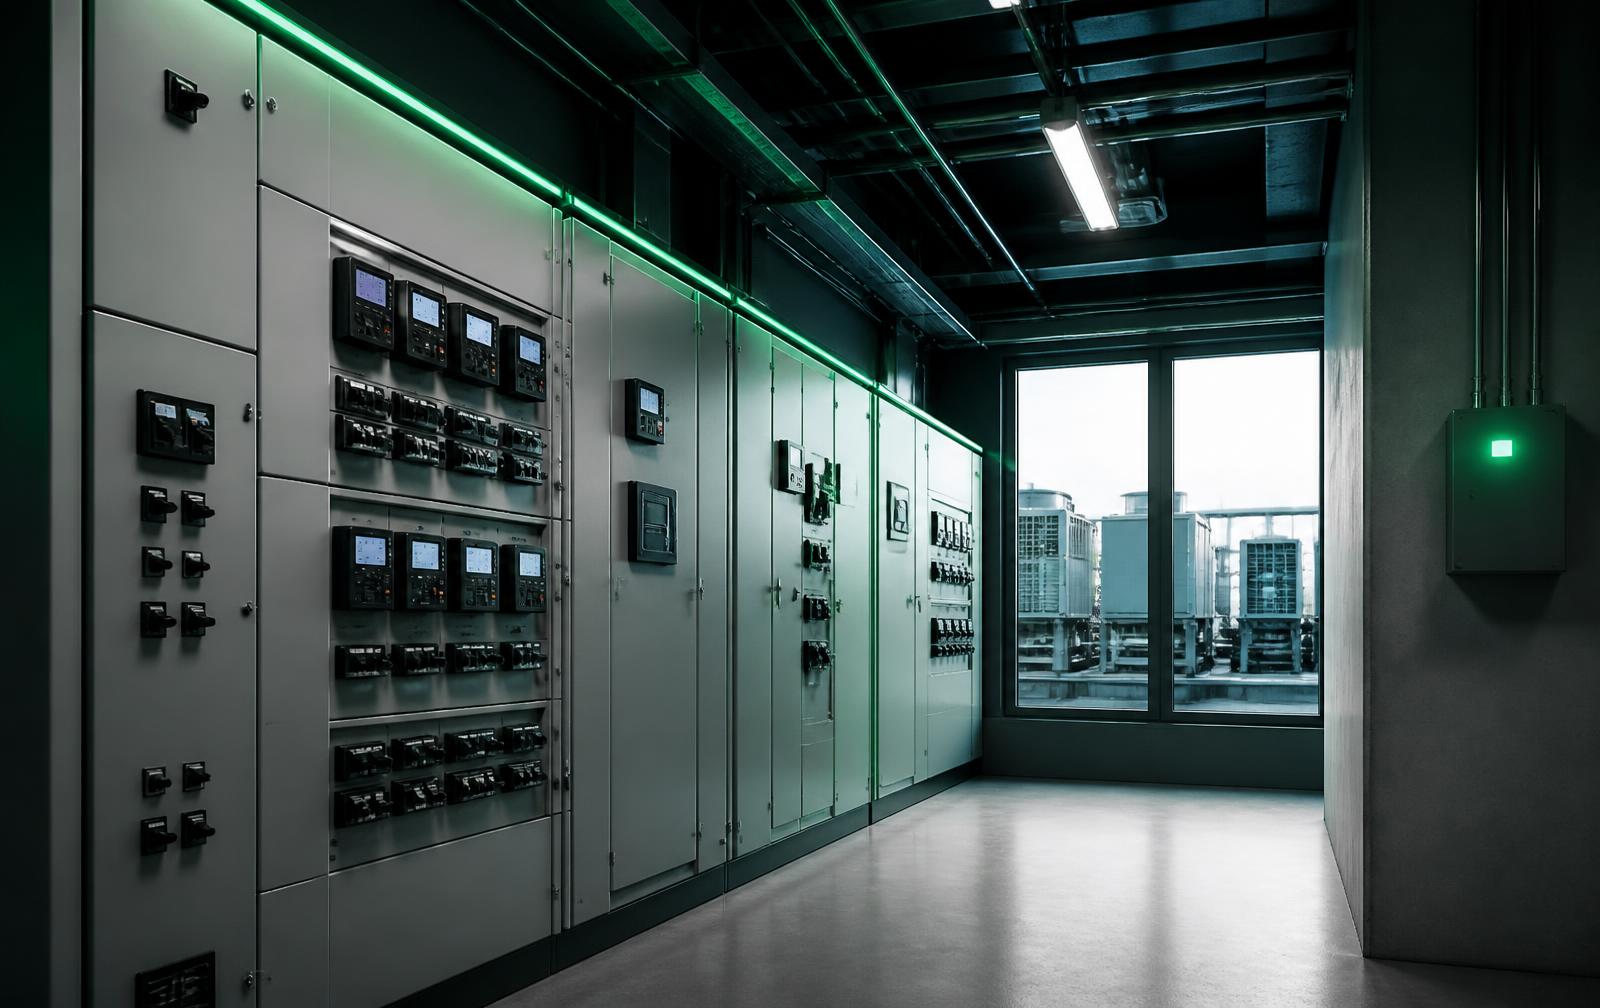
Control Every Building.
Optimize Every Utility.
Jugno Core is more than a building management system. It is a smart infrastructure intelligence platform that unifies energy, HVAC, DG, water and equipment data across data centres, warehouses, manufacturing facilities, commercial buildings, hospitals, hotels and campuses into one operational model.
Today
8,421kWh
Peak demand
612kVA
Power factor
0.96
DG
Standby
Consumption by hour
HVAC · Utilities · ProcessHVAC
Normal
Water
Normal
Power quality
Watch
Illustrative interface. Values shown are examples, not measured data.
A smart infrastructure platform for enterprises that operate buildings and utilities
Jugno Core is deployed by organisations running energy-intensive, service-critical facilities across single sites and large portfolios.
Manufacturing Plants
Plant utilities, energy and infrastructure teams
Warehouses
Distribution centres and logistics facilities
Data Centers
Power, cooling and uptime critical infrastructure
Commercial Buildings
Office towers and multi-tenant properties
Malls
Retail complexes with shared utility loads
Hospitals
Critical healthcare infrastructure and backup power
Hotels
Hospitality energy, HVAC and water operations
Campuses
Educational and corporate multi-building estates
Co-working Spaces
Shared workspaces with per-tenant utility billing
Airports
Terminal utilities, HVAC and critical services
Industrial Parks
Multi-occupant industrial estates and utilities
Smart Buildings
Automated buildings with integrated building services
From the data centre floor to the hospital plant room
Jugno Core carries the same energy model, alerting and reporting layer across every physical environment an enterprise operates.
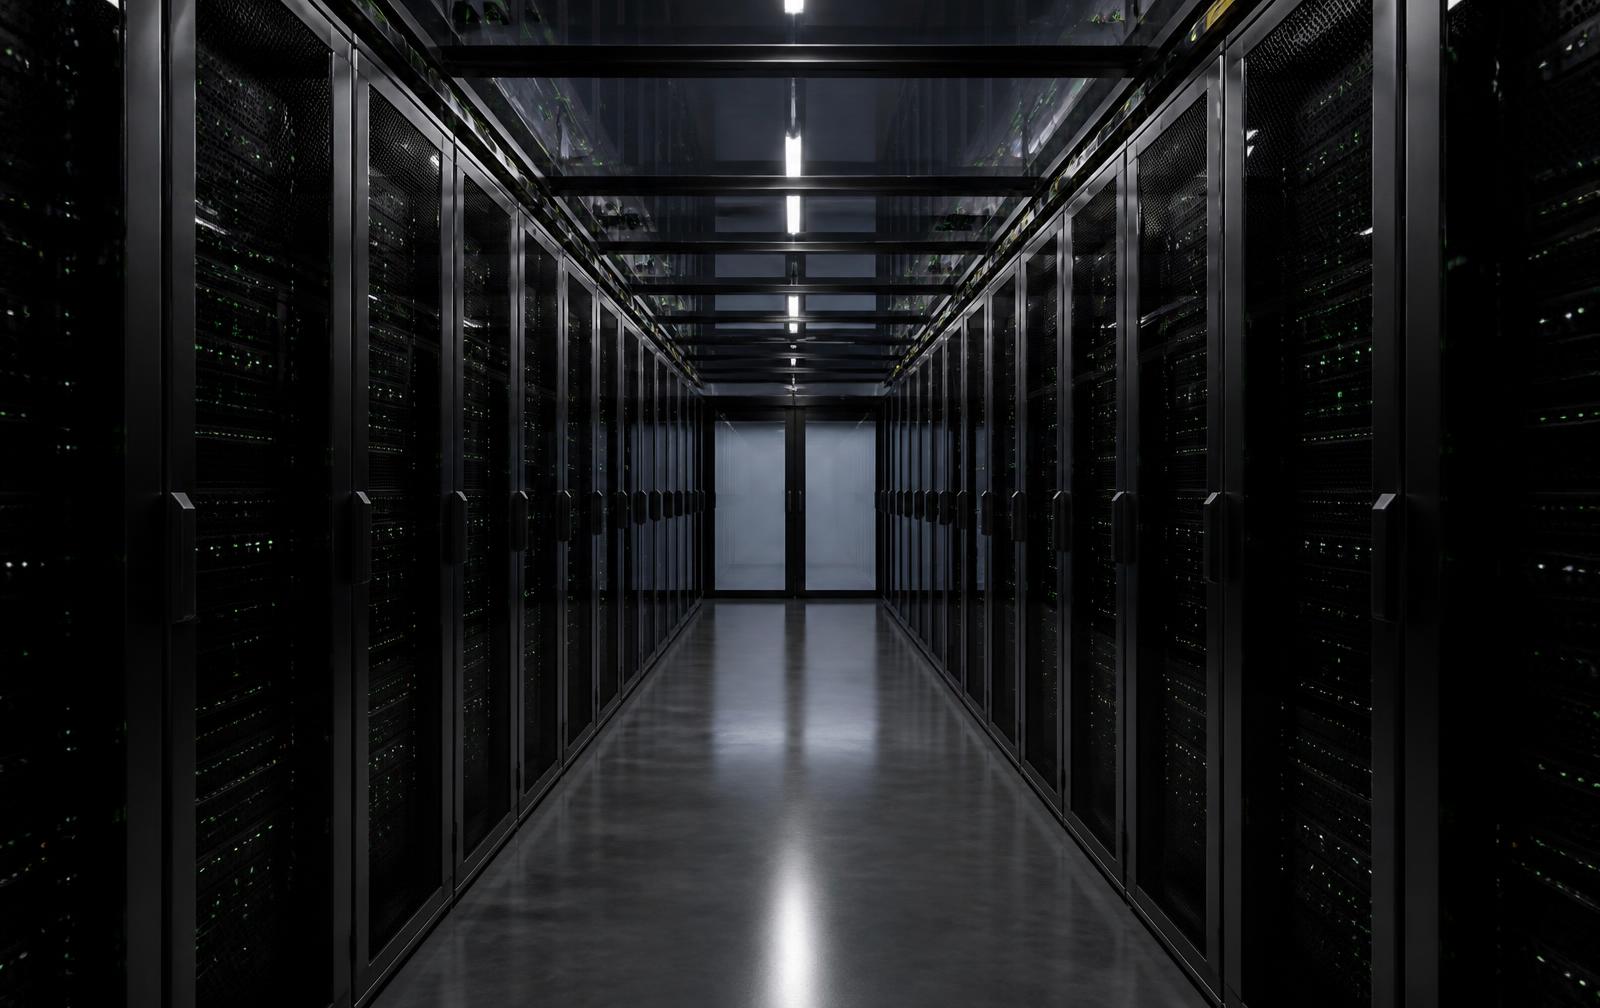
Uptime-critical power and cooling
Incomer, UPS, DG and cooling load monitored together, so a change in one system is understood in the context of the others rather than in isolation.
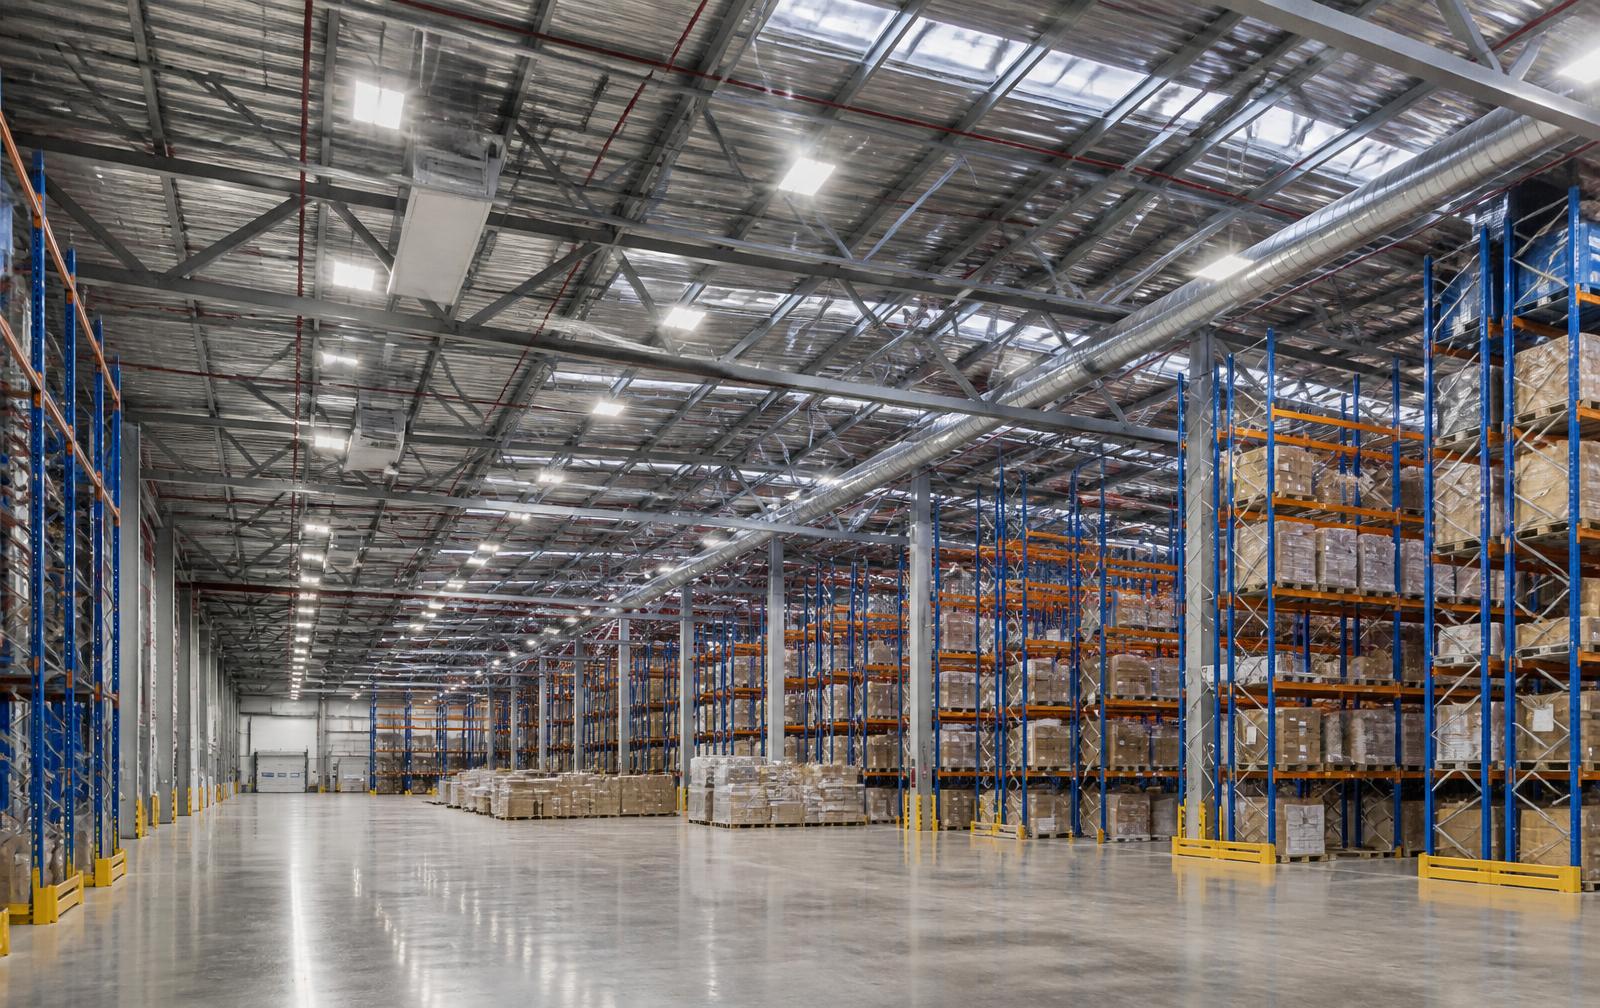
Large-footprint utility visibility
Lighting, HVAC zones, dock equipment and water systems across a large floor plate measured from feeder level down to the individual zone.

Tenant and floor-level attribution
Multi-tenant towers measured down to floor and tenant level, supporting accurate cost allocation alongside building-wide energy and lift monitoring.
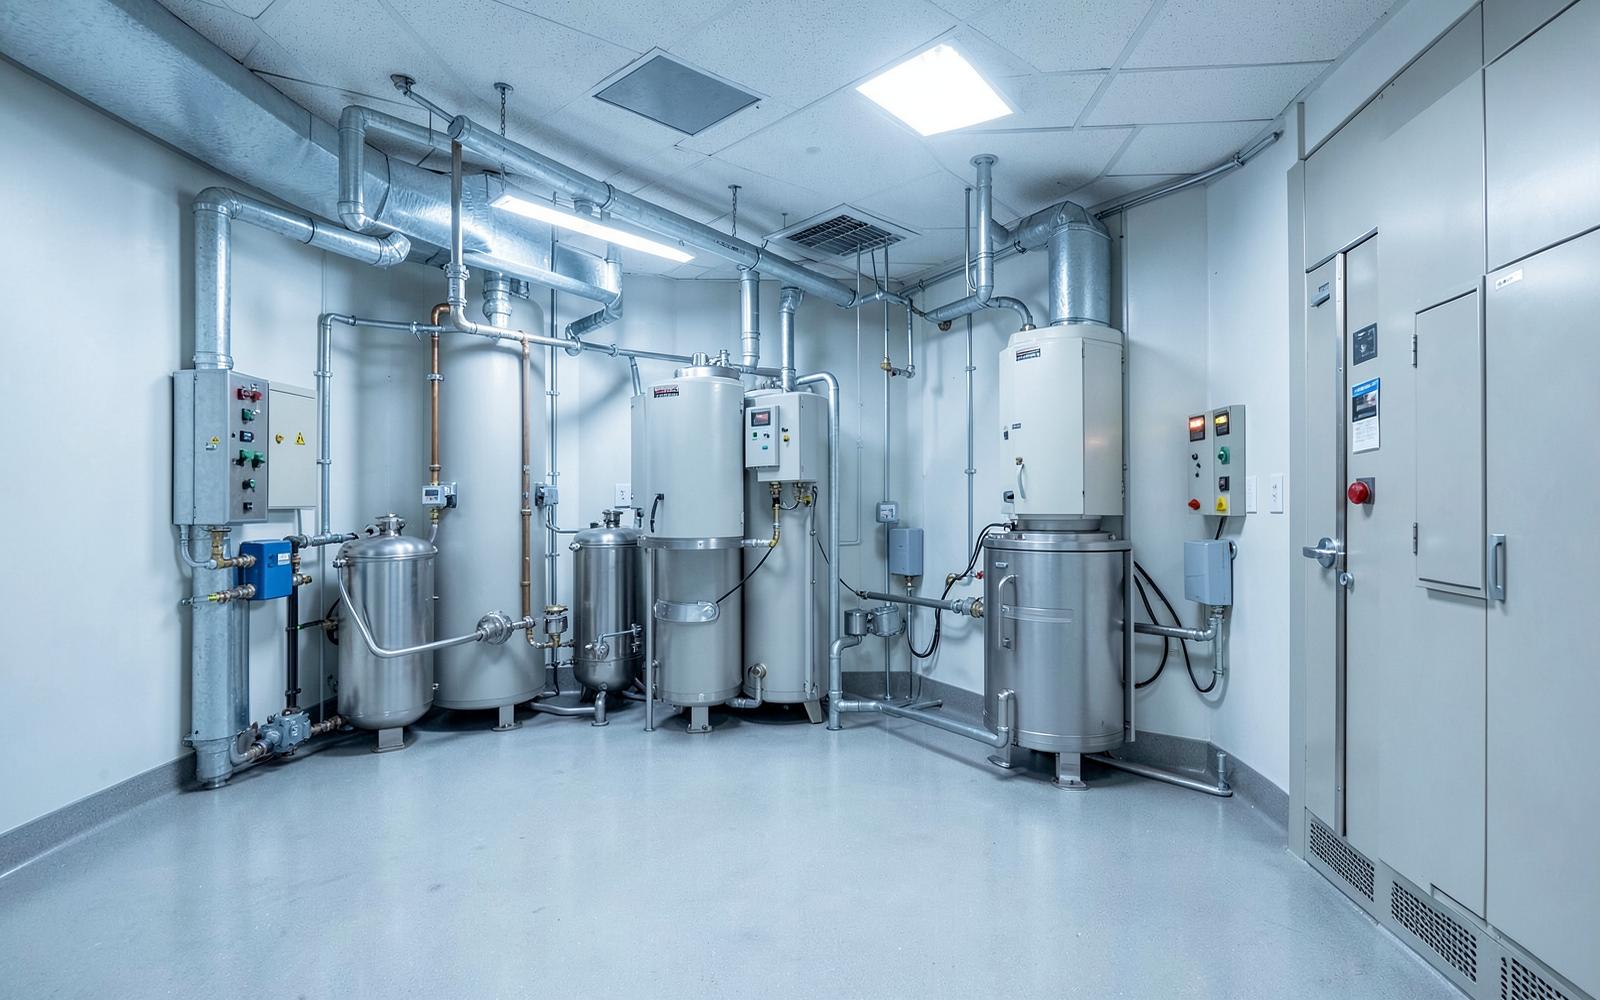
Backup power visibility and operational intelligence
DG readiness, HVAC and water systems in critical facilities monitored continuously, with changeover events and run hours recorded against site protocols.
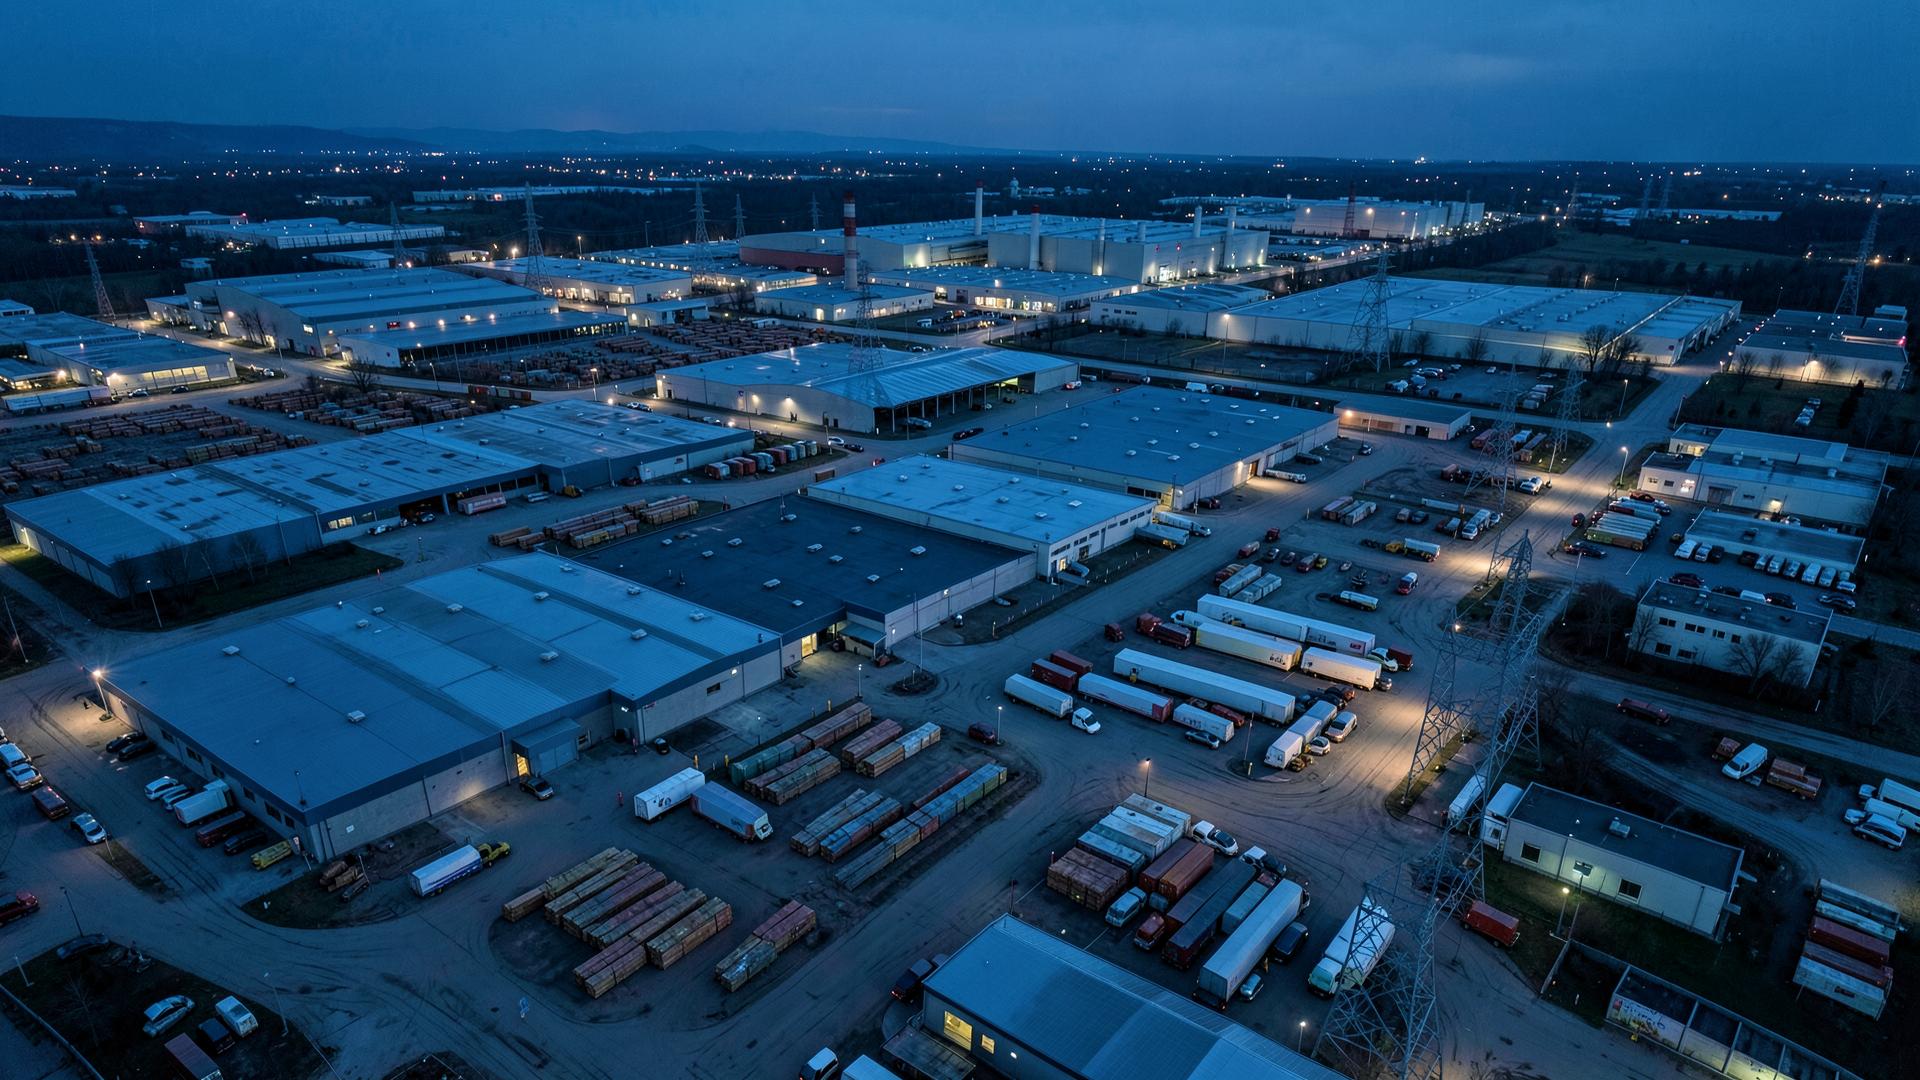
One view across every building
Educational and corporate campuses with multiple buildings compared side by side, with a single enterprise view rolled up from every connected site.
Smart infrastructure intelligence, purpose-built
Industrial IoT hardware, edge connectivity, cloud software, mobile applications, APIs and AI analytics across every building and utility.
Energy Monitoring
Electrical consumption measured at incomer, feeder, floor and tenant level with load profiles across every site.
Building Management
Building services brought into one operating view — HVAC, lighting, pumps, lifts and utility systems.
HVAC Monitoring
Air handling units, ventilation and cooling performance tracked against setpoints, occupancy and ambient conditions.
DG Monitoring
Diesel generator availability, run hours, fuel consumption and auto-changeover events across every site.
Compressor Monitoring
Air compressor load, unload, pressure and specific energy consumption tracked per compressor room.
Water Monitoring
Fresh water, treated water and recycled water flows measured with leak and abnormal consumption detection.
Power Quality
Voltage, current, power factor, harmonics and unbalance recorded to protect connected equipment.
Utility Analytics
AI analytics on consumption, baselines, benchmarks and cost per building, tenant and asset class.
Alerts & Automation
Threshold, event and model-driven alerts with escalation, schedules and automated control actions.
Grid to action, in one continuous model
The same utility path across every facility — from incoming power to the recommendation reaching a facility team.
Grid
Utility incoming supply and transformer intake.
- Incomer
- Transformer
Panel
Distribution boards, feeders and sub-metering points.
- LT Panel
- Feeders
- Sub-meters
Energy
Consumption, demand and power quality measured continuously.
- kWh
- kVA
- Power factor
HVAC / DG / Water
Building services running against the same measured baseline.
- Chillers
- DG sets
- Water
Equipment
Pumps, lifts, compressors and process loads on site.
- Pumps
- Lifts
- Compressors
Core
One data model across every building and utility asset.
- Asset model
- History
- Context
Intelligence
Baselines, anomalies and benchmarks against your own facilities.
- Anomaly detection
- Benchmarking
Action
Alerts and recommendations reaching facility and energy teams.
- Dashboards
- Mobile
- Alerts
Every building, every utility, every alert in one operational view
Facility heads, energy managers and engineering teams work from the same infrastructure data: live consumption, equipment status, power quality and open alerts across sites.
Today
8,421kWh
Peak demand
612kVA
Power factor
0.96
DG
Standby
Consumption by hour
HVAC · Utilities · ProcessHVAC
Normal
Water
Normal
Power quality
Watch
Illustrative interface. Values shown are examples, not measured data.
Facility 01
Consumption above pattern
8,421
kWh today
- Peak demand612 kVA
- HVAC share38%
- Open alerts2
Facility operations app
From a pattern to an explainable action
Every insight from Jugno Core shows the normal pattern, the anomaly detected, the analysis behind it and the recommended next step.
Intelligence trace
IllustrativeWhy did energy consumption increase yesterday?
Consumption rose outside the expected operating pattern for this facility.
Normal pattern
Weekday baseline of roughly 7,100 kWh
Anomaly
8,421 kWh, concentrated between 14:00 and 17:00
Analysis
Largest variance associated with HVAC load
Possible cause
Extended cooling with no matching occupancy change
Recommended action
Review HVAC scheduling and setpoints for the afternoon block, then confirm against the next operating day.
One structure from the enterprise to a single data point
Every meter, panel, HVAC system and piece of equipment is modelled consistently, so an enterprise view and a single asset describe the same underlying data.
- 1
Enterprise
Group-level view across every connected facility
- 2
Site
Plant, campus, hospital or commercial building
- 3
Building / Area
Tower, block, floor or utility zone
- 4
System
HVAC plant, DG room, water network, LT panel
- 5
Asset
Chiller, generator, pump, meter or lift
- 6
Data point
Load, temperature, pressure, energy, flow
Deployed the way your enterprise operates
Cloud
Fully managed multi-site deployment on the Jugno Core cloud
On-premise
Deployed inside enterprise infrastructure where data must stay on site
Hybrid
Edge processing at site with selective synchronisation to the cloud
Enterprise API
REST APIs into ERP, BMS, CAFM, sustainability and BI systems
White-label Options
Platform delivered under your own brand, domain and applications
From utility data to enterprise value
Monitor
Grid, panel, load, HVAC, DG, water and gas
Understand
Consumption in the context of operations
Detect anomaly
Deviation from established patterns
Identify pattern
Which system and period drove the change
Recommend
Operational corrections worth reviewing
Optimise
Better utility performance across the portfolio
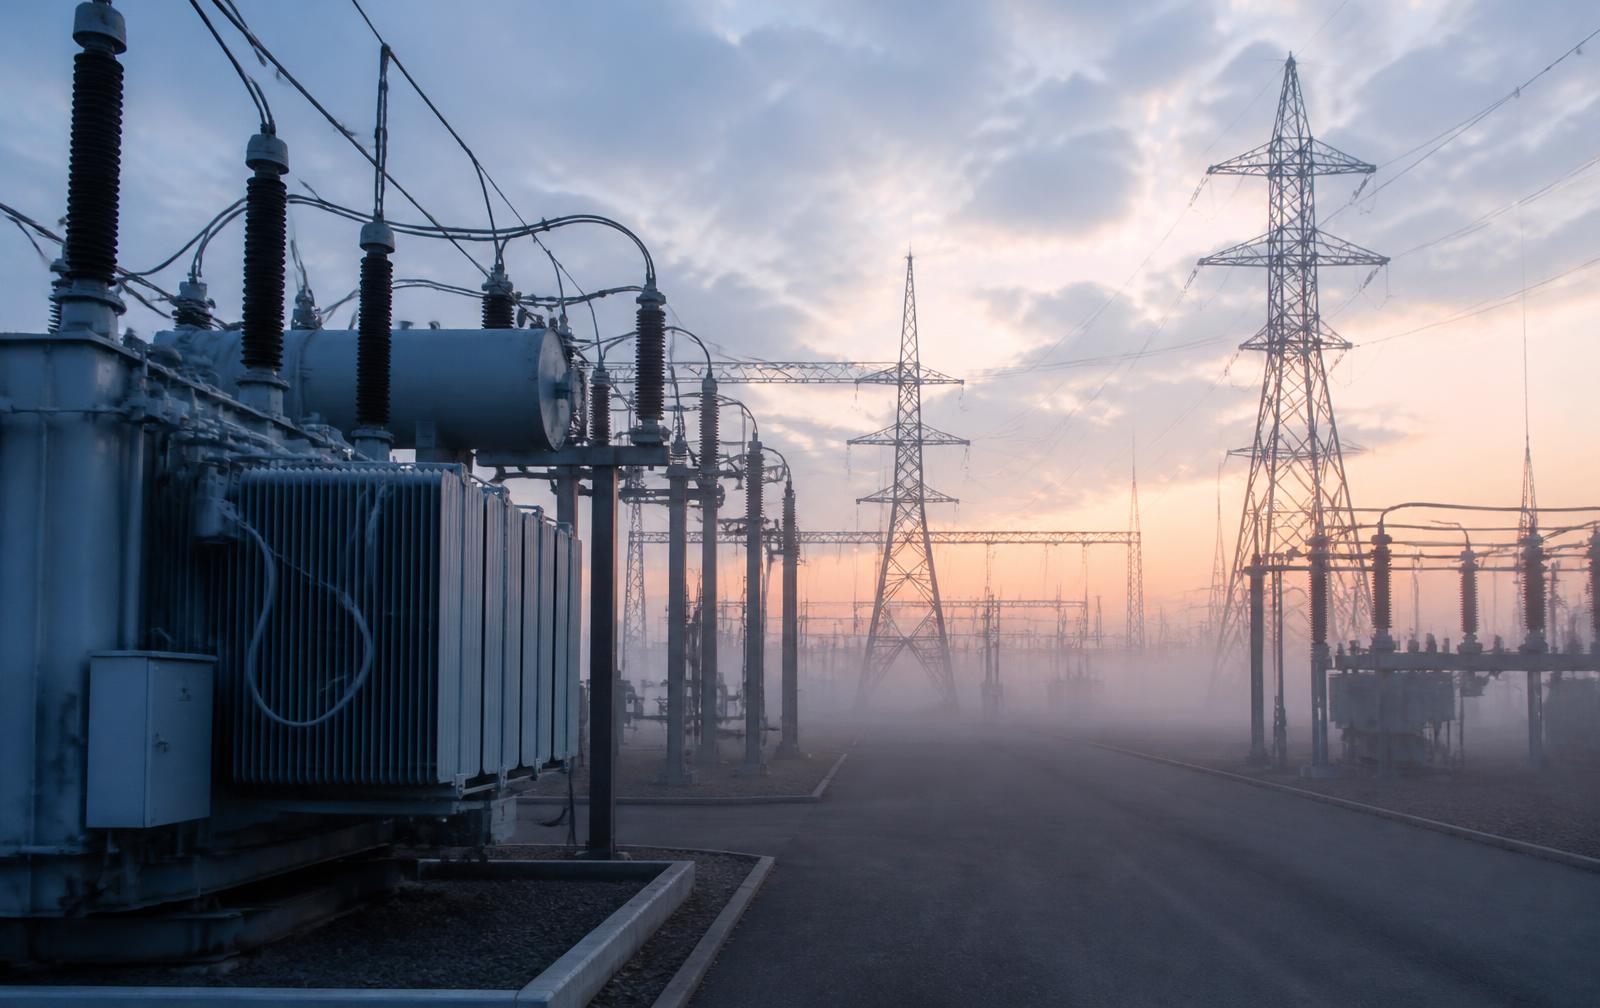
Built for facilities where downtime and waste are measured in cost
Manufacturing plants, data centres, warehouses, commercial buildings, hospitals, hotels and campuses run on the same Jugno Core intelligence layer.
What facility, energy and engineering teams measure
Consolidate Utility Data
Energy, water, gas and building services brought into one measured view per site and portfolio.
Improve Equipment Reliability
Operate building services within design limits using recorded parameter history.
Increase Asset Utilization
Raise utilisation of chillers, DG sets, compressors and building equipment.
Reduce Downtime
Detect developing utility and equipment faults before services are interrupted.
Report on Energy & Utility Performance
Track energy, water and utility performance against operational targets and baselines.
Attribute Consumption Accurately
Tenant, floor and area-level attribution for cost allocation and billing.
Where Jugno Core is deployed
Manufacturing
Warehousing
Data Centers
Commercial Buildings
Hospitals
Hotels
Retail
Campuses
Common questions from facility, energy and engineering teams
Jugno Core is a Smart Infrastructure Intelligence Platform. It combines energy management, building management, utility monitoring, AI analytics and Industrial IoT into one enterprise platform for buildings, utilities and critical infrastructure.
No. The Jugno Edge Gateway reads from existing energy meters, BMS controllers, PLCs and field devices over standard industrial and building protocols. Sensors are added only where a parameter is not already measured.
Electrical energy, water, gas, HVAC, DG sets, compressors, chillers, lifts, pumps and other building services are supported as standard, with additional asset classes added through the same integration layer.
Yes. Core is built for multi-site portfolios, with consumption, alerts and benchmarks compared across buildings, tenants, regions and asset classes from a single view.
Cloud, on-premise and hybrid deployments are supported, together with enterprise APIs and white-label delivery under your own brand and domain.
Yes. REST APIs expose utility, alert, consumption and asset data to ERP, CAFM, BMS, sustainability reporting and business intelligence systems.
Ready to Modernize Your Buildings and Utilities?
Talk to our team about edge hardware, cloud deployment, mobile applications and AI analytics for your buildings and utilities.